Yesterday I described how I come to SQLT Xplore and it helped me to find out, on Oracle 12.2.0.1, that optimizer_features_enable=8.1.3 decreased the parsing time of a query from 5 seconds to 0.2 seconds. Today I show how to use SQLT Xplore.
What is SQLT Xplore?
SQL Xplore automatises the test of almost 2’000 optimizer parameters and bug fixes control against one query, allowing to discover which parameter was eventually the reason of a performance regression.
SQLT Xplore should only be used when ALL these conditions are met (a bit shorter version than the one mentioned by Oracle):
- SQL performs poorly or returns wrong results while using a “bad” plan.
- You can reproduced the problem on a test system.
- A “better” plan can be reproduced on the test system by changing the value of optimizer_features_enabled parameter.
- You want to narrow reason to specific parameter or bug fix control.
- You have full access to the test system, including
SYSaccess.
Do not use SQLT Xplore when ANY of these conditions is true:
- The SQL statement may cause corruption or update data.
- The execution of the SQL may take longer than a few seconds.
Download, docs and unzip:
- Download SQLT (including SQLT Xplore) – current version June 2020
- All About the SQLT Diagnostic Tool (Doc ID 215187.1)
- SQLT Usage Instructions (Doc ID 1614107.1)
SQLT Xplore is completely independent from other SQLT tools. It is not necessary to install other SQLT tools.
After unzipping SQLT, the SQLT Xplore is located at:
<unzip location>/sqlt/utl/xplore
Create file with SQL to analyze
Important in the SQL to analyze, is that this SQL includes as comment the line with ^^unique_id and finishes with a semicolon. Remember to use full qualified names, to access the data on the correct schema. I created a file called anjo.sql with the content:
select
  /* ^^unique_id */
       <rest of SQL> ;
Attention that the full output of the query will appear and will be spooled hundred of times. If the the output has thousands of lines, maybe consider to change the query to have a smaller output.
Install and configure SQLT Xplore
In case you know the password of the user running the query, you can use that user. Otherwise, use a your personal user. This user will receive DBA and SELECT ANY DICTIONARY privileges and some tables and procedures will be created. In my case, I installed into my user ANJO. The actual data is in another schema:
cd sqlt/utl/xplore
sqlplus / as sysdba
SQL> @install
Test Case User: anjo
Password: ******
...
Package created.
No errors.
Package body created.
No errors.

Installation completed.
You are now connected as anjo.

1. Set CBO env if needed
2. Execute @create_xplore_script.sql

SQL>
Now, connected with my user ANJO, we configure how Xplore will run and which tests will it run. In my case, as I’m not on Exadata, I’ve excluded that. The rest I’ve left the default values:
SQL> @create_xplore_script.sql

Parameter 1:
XPLORE Method: XECUTE (default) or XPLAIN
"XECUTE" requires /* ^^unique_id */ token in SQL
"XPLAIN" uses "EXPLAIN PLAN FOR" command
Remember EXPLAIN PLAN FOR does not perform bind peeking
Remember CREATE TABLE AS SELECT statements are not supported (See Note 1963444.1)
Enter "XPLORE Method" [XECUTE]:

Parameter 2:
Include CBO Parameters: Y (default) or N
Enter "CBO Parameters" [Y]:

Parameter 3:
Include Exadata Parameters: Y (default) or N
Enter "EXADATA Parameters" [Y]: N

Parameter 4:
Include Fix Control: Y (default) or N
Enter "Fix Control" [Y]:

Parameter 5:
Generate SQL Monitor Reports: N (default) or Y
Only applicable when XPLORE Method is XECUTE
Enter "SQL Monitor" [N]:

Review and execute @xplore_script_1.sql
Run SQLT Xplore
We can now start Xplore (still on my user ANJO), which will asks the file with the SQL to analyse and the password of our user:
SQL>  @xplore_script_1.sql

CONNECTED_USER
------------------------------
ANJO

Parameter 1:
Name of SCRIPT file that contains SQL to be xplored (required)
Note: SCRIPT must contain comment /* ^^unique_id */

Enter value for 1: anjo.sql

Parameter 2:
Password for ANJO (required)

Enter value for 2: ******

Value passed to xplore_script.sql:
~~~~~~~~~~~~~~~~~~~~~~~~~~~~~~~~~
SCRIPT_WITH_SQL: anjo.sql

-- begin common
...
I had one error short after:
SQL>EXEC xplore.snapshot_plan('xplore_{001}_[^^run_id.]_(00000)', 'XECUTE', 'N');
BEGIN xplore.snapshot_plan('xplore_{001}_[0001]_(00000)', 'XECUTE', 'N'); END;

*
ERROR at line 1:
ORA-01422: exact fetch returns more than requested number of rows
ORA-06512: at "ANJO.XPLORE", line 744
ORA-06512: at line 1
The problem is that for some reason the query he looks for in v$sql is already more than once in the shared pool. The radical solution is to flush the shared pool:
SQL> ALTER SYSTEM FLUSH SHARED_POOL;
Other more targeted solution, is to clean only the queries from the Xplore first test:
begin
  for c in (select address,hash_value,sql_text from v$sqlarea WHERE sql_text LIKE '%xplore_{00%(000%' AND plan_hash_value <> 0 AND sql_text NOT LIKE '%FROM v$sql%')
    loop
      sys.dbms_shared_pool.purge(c.address||','||c.hash_value,'...');
    end loop;
  end;
/
The run should now successfully go. Depending on the normal time the query takes to run, it can take a couple of hours for all the almost 2’000 tests.
Checking results of SQLT Xplorer
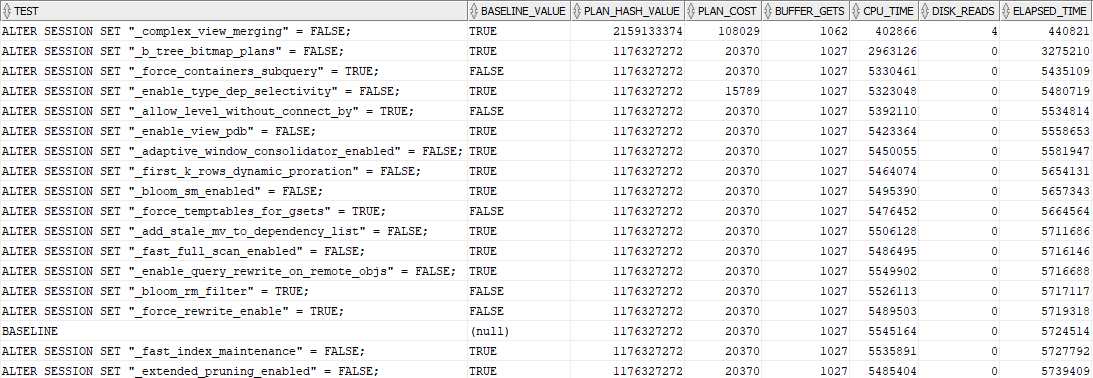
You can follow the results, ordered by the faster solution so far, using:
SQL> SELECT * FROM ANJO.XPLORE_TEST WHERE plan_cost IS NOT NULL ORDER BY elapsed_time;
There is a test named ‘BASELINE’ which has the result of the run without any change.
For all other runs, there are a full hand of statistics, like the plan cost, buffer gets, disk reads, cpu and elapset time, cardinality and rows processed.
There are other interesting tables:
- XPLORE_TEST – the main result table, as from above. There is run_id and test_id column that match for the following table.
- DISCOVERED_PLAN – the explain plan for each of the test, with column test_id
- BASELINE_PARAMETER_CBO – with the current database optimizer settings
- PLAN_TABLE_ALL – probably used internally
- SQL_MONITOR – used in case this option selected
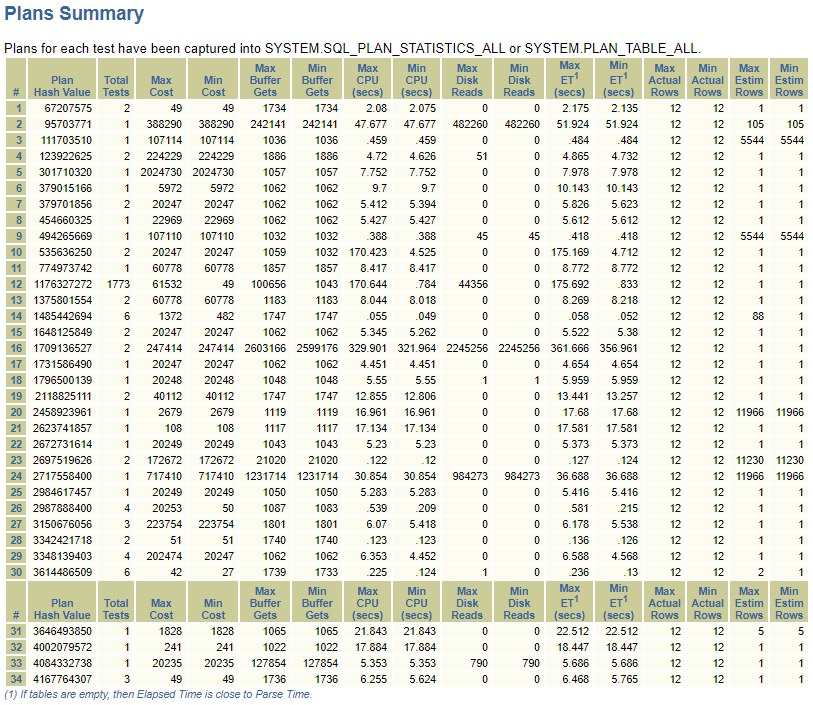
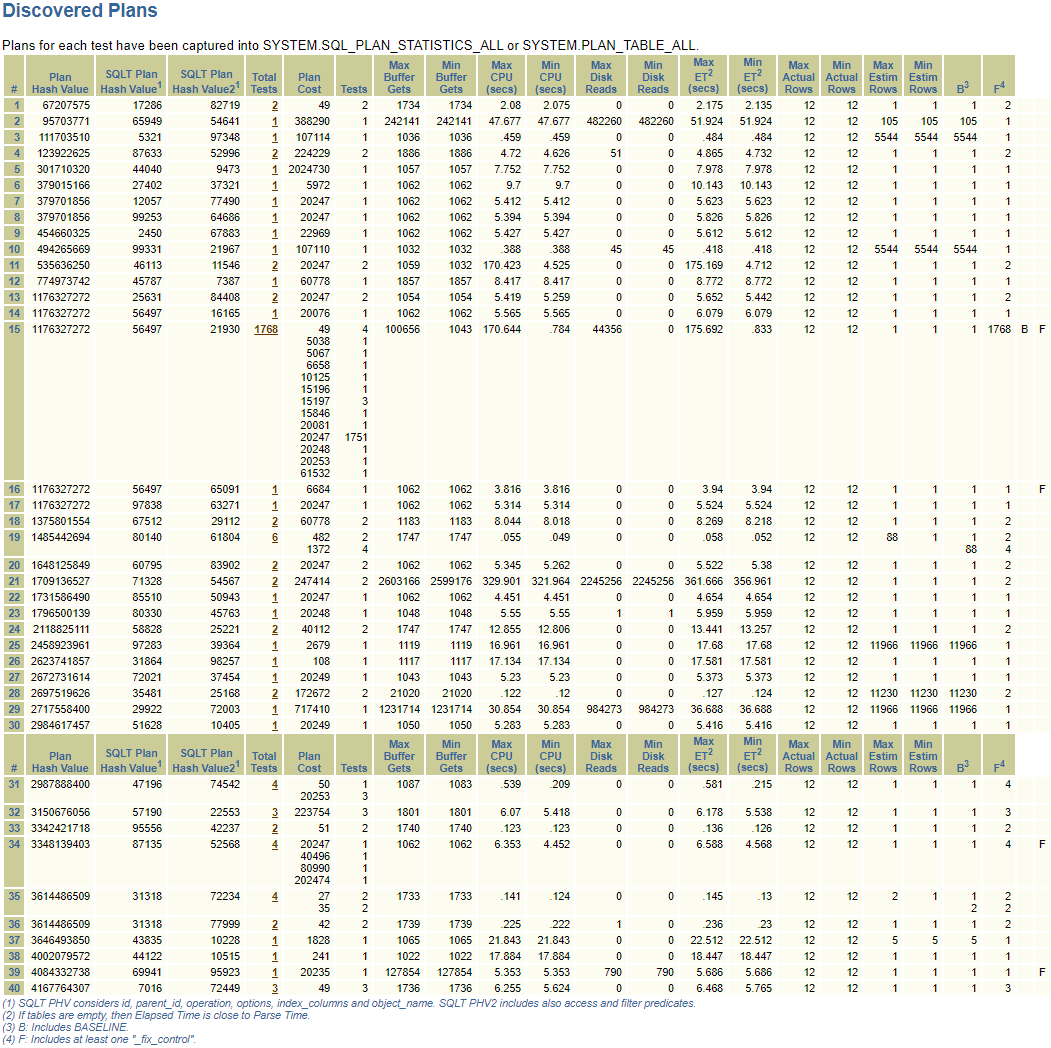
At the end of the run there is a zip file created, with three files:
- xplore_report_1.html – a summary of the runs, based on the different plans generated; details of result per plan and the baseline and the plan generated on each of the test
- xplore_script1.log – output of the run
- xplore_script1.sql – the script that was run
Example of summary generated in html:
Uninstall and cleanup
As some ‘alter system .. scope=memory’ are performed, Oracle recommends to bounce the instance at the end of the test. If all went well, the previous parameters should be normally set.
To uninstall SQLT Xplorer, just run the right script as SYS:
sqlplus / as sysdba

SQL> @uninstall
Test Case User: anjo
old   1: DROP PACKAGE BODY &&test_case_user..xplore
new   1: DROP PACKAGE BODY anjo.xplore

Package body dropped.
...